
Earth Observation Data
18 products measured over the parcel boundary, 198 columns in all. Each says what it holds, at what resolution, and which flag says whether it was measured.
Land cover
- Resolution30 m
- Measured overWhole parcel boundary
- Time window2025
- UpdatedYearly
Land cover in sixteen classes on a 30 m grid, classified from satellite imagery, one class to a cell and one map for every year since 1985. For each parcel the release carries the share of its area in each class and the class covering the most of it; the sixteen shares add to one. The classes and their definitions are below. The publisher states that mapped features may not be in an exact geographic location and that the data may be corrected or replaced without notification.
Readings and coverage
The share of parcels in each state that carry a value for the reading.
- Land cover — a value on every parcel of all 8 states
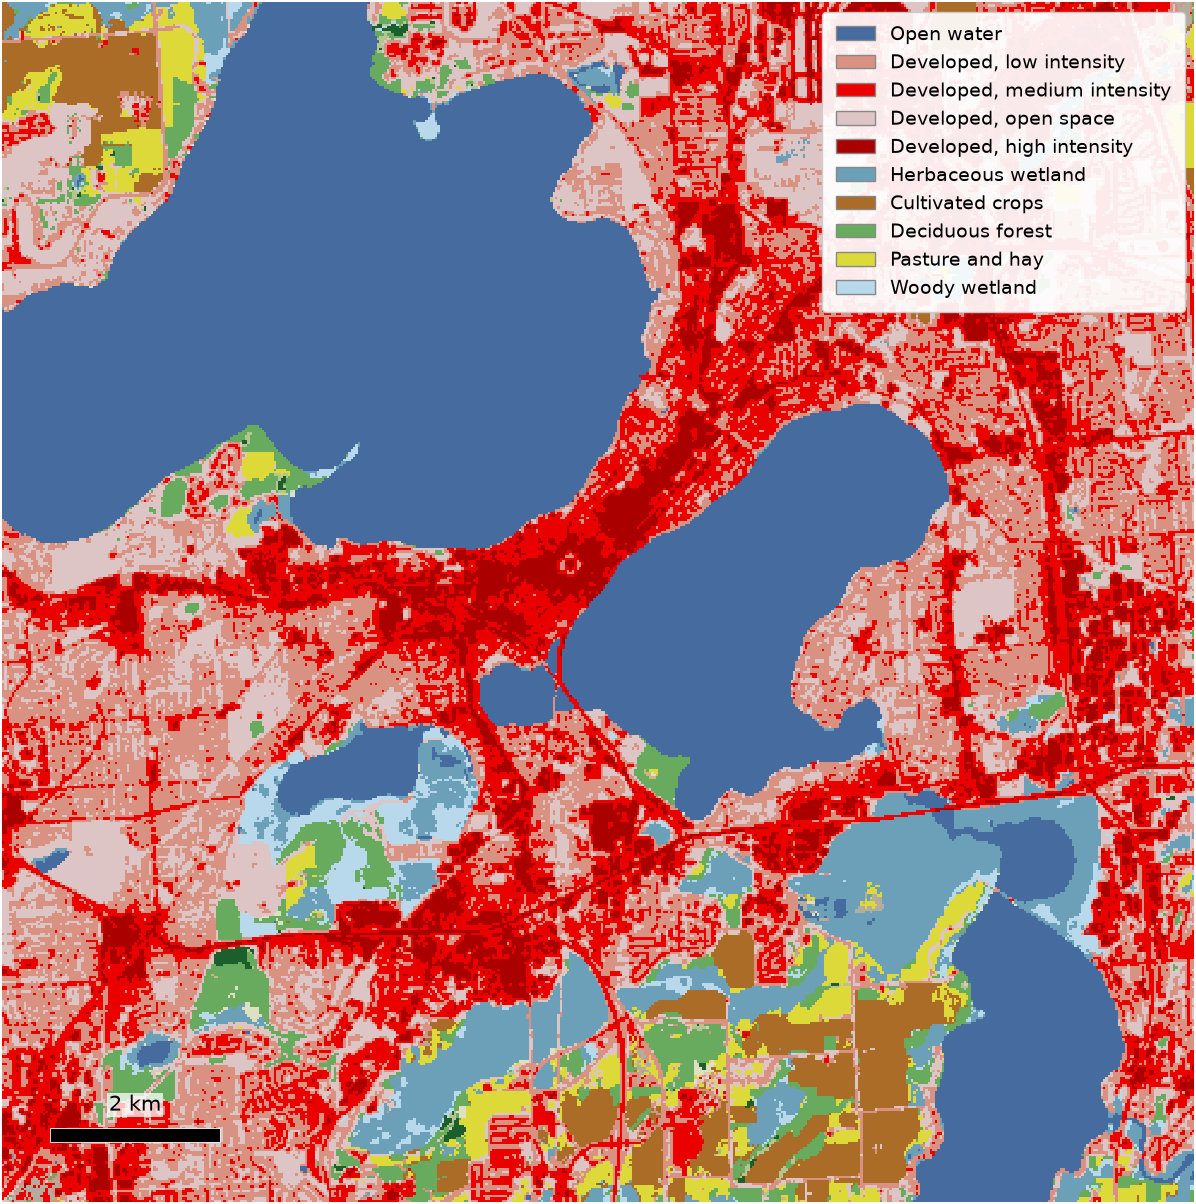
Main land cover: the classes
| Code | Class | Definition |
|---|---|---|
11 | Open water | Areas of open water, generally with less than 25% cover of vegetation or soil. |
12 | Perennial ice and snow | Areas characterised by a perennial cover of ice or snow, generally greater than 25% of total cover. |
21 | Developed, open space | A mixture of some constructed materials, but mostly vegetation in the form of lawn grasses; impervious surfaces account for less than 20% of total cover. Most commonly large-lot single-family housing, parks, golf courses and vegetation planted for recreation, erosion control or aesthetic purposes. |
22 | Developed, low intensity | A mixture of constructed materials and vegetation; impervious surfaces account for 20% to 49% of total cover. Most commonly single-family housing units. |
23 | Developed, medium intensity | A mixture of constructed materials and vegetation; impervious surfaces account for 50% to 79% of total cover. Most commonly single-family housing units. |
24 | Developed, high intensity | Highly developed areas where people reside or work in high numbers, such as apartment complexes, row houses and commercial or industrial buildings; impervious surfaces account for 80% to 100% of total cover. |
31 | Barren land | Areas of bedrock, desert pavement, scarps, talus, slides, volcanic material, glacial debris, sand dunes, strip mines, gravel pits and other accumulations of earthen material; vegetation generally accounts for less than 15% of total cover. |
41 | Deciduous forest | Areas dominated by trees generally greater than 5 m tall and greater than 20% of total vegetation cover, where more than 75% of the tree species shed foliage simultaneously in response to seasonal change. |
42 | Evergreen forest | Areas dominated by trees generally greater than 5 m tall and greater than 20% of total vegetation cover, where more than 75% of the tree species keep their leaves all year. |
43 | Mixed forest | Areas dominated by trees generally greater than 5 m tall and greater than 20% of total vegetation cover, where neither deciduous nor evergreen species are more than 75% of total tree cover. |
52 | Shrub and scrub | Areas dominated by shrubs less than 5 m tall, with shrub canopy typically greater than 20% of total vegetation; includes true shrubs, young trees in an early successional stage and trees stunted by environmental conditions. |
71 | Grassland | Areas dominated by graminoid or herbaceous vegetation, generally greater than 80% of total vegetation, not subject to intensive management such as tilling but usable for grazing. |
81 | Pasture and hay | Areas of grasses, legumes or grass-legume mixtures planted for livestock grazing or the production of seed or hay crops, typically on a perennial cycle; this vegetation accounts for greater than 20% of total vegetation. |
82 | Cultivated crops | Areas used for annual crops such as corn, soybeans, vegetables, tobacco and cotton, and perennial woody crops such as orchards and vineyards; crop vegetation accounts for greater than 20% of total vegetation. Includes all land being actively tilled. |
90 | Woody wetland | Areas where forest or shrubland vegetation accounts for greater than 20% of vegetative cover and the soil or substrate is periodically saturated with or covered by water. |
95 | Herbaceous wetland | Areas where perennial herbaceous vegetation accounts for greater than 80% of vegetative cover and the soil or substrate is periodically saturated with or covered by water. |
Fields
| Field | Unit | Measured flag | Description |
|---|---|---|---|
landcover_dominant_class | landcover_coverage | Land cover class code covering most of the parcel | |
landcover_dominant_class_label | landcover_coverage | Name of the land cover class covering the most of the parcel. | |
landcover_dominant_fraction | fraction 0–1 | landcover_coverage | Share of the parcel in its largest land cover class |
landcover_water_fraction | fraction 0–1 | landcover_coverage | Share of the parcel in open water |
landcover_ice_snow_fraction | fraction 0–1 | landcover_coverage | Share of the parcel in perennial ice or snow |
landcover_developed_fraction | fraction 0–1 | landcover_coverage | Share of the parcel in developed land, all intensities |
landcover_barren_fraction | fraction 0–1 | landcover_coverage | Share of the parcel in barren land |
landcover_deciduous_forest_fraction | fraction 0–1 | landcover_coverage | Share of the parcel in deciduous forest |
landcover_evergreen_forest_fraction | fraction 0–1 | landcover_coverage | Share of the parcel in evergreen forest |
landcover_mixed_forest_fraction | fraction 0–1 | landcover_coverage | Share of the parcel in mixed forest |
landcover_shrub_fraction | fraction 0–1 | landcover_coverage | Share of the parcel in shrub or scrub |
landcover_grassland_fraction | fraction 0–1 | landcover_coverage | Share of the parcel in grassland or herbaceous cover |
landcover_pasture_fraction | fraction 0–1 | landcover_coverage | Share of the parcel in pasture or hay |
landcover_cultivated_crops_fraction | fraction 0–1 | landcover_coverage | Share of the parcel in cultivated crops |
landcover_woody_wetland_fraction | fraction 0–1 | landcover_coverage | Share of the parcel in woody wetland |
landcover_herbaceous_wetland_fraction | fraction 0–1 | landcover_coverage | Share of the parcel in emergent herbaceous wetland |
landcover_coverage | | Whether land cover was measured on this parcel, or the source does not cover it. |
Cropland
- Resolution30 m to 2023, 10 m from 2024
- Measured overWhole parcel boundary
- Time window2025 crop year
- UpdatedYearly
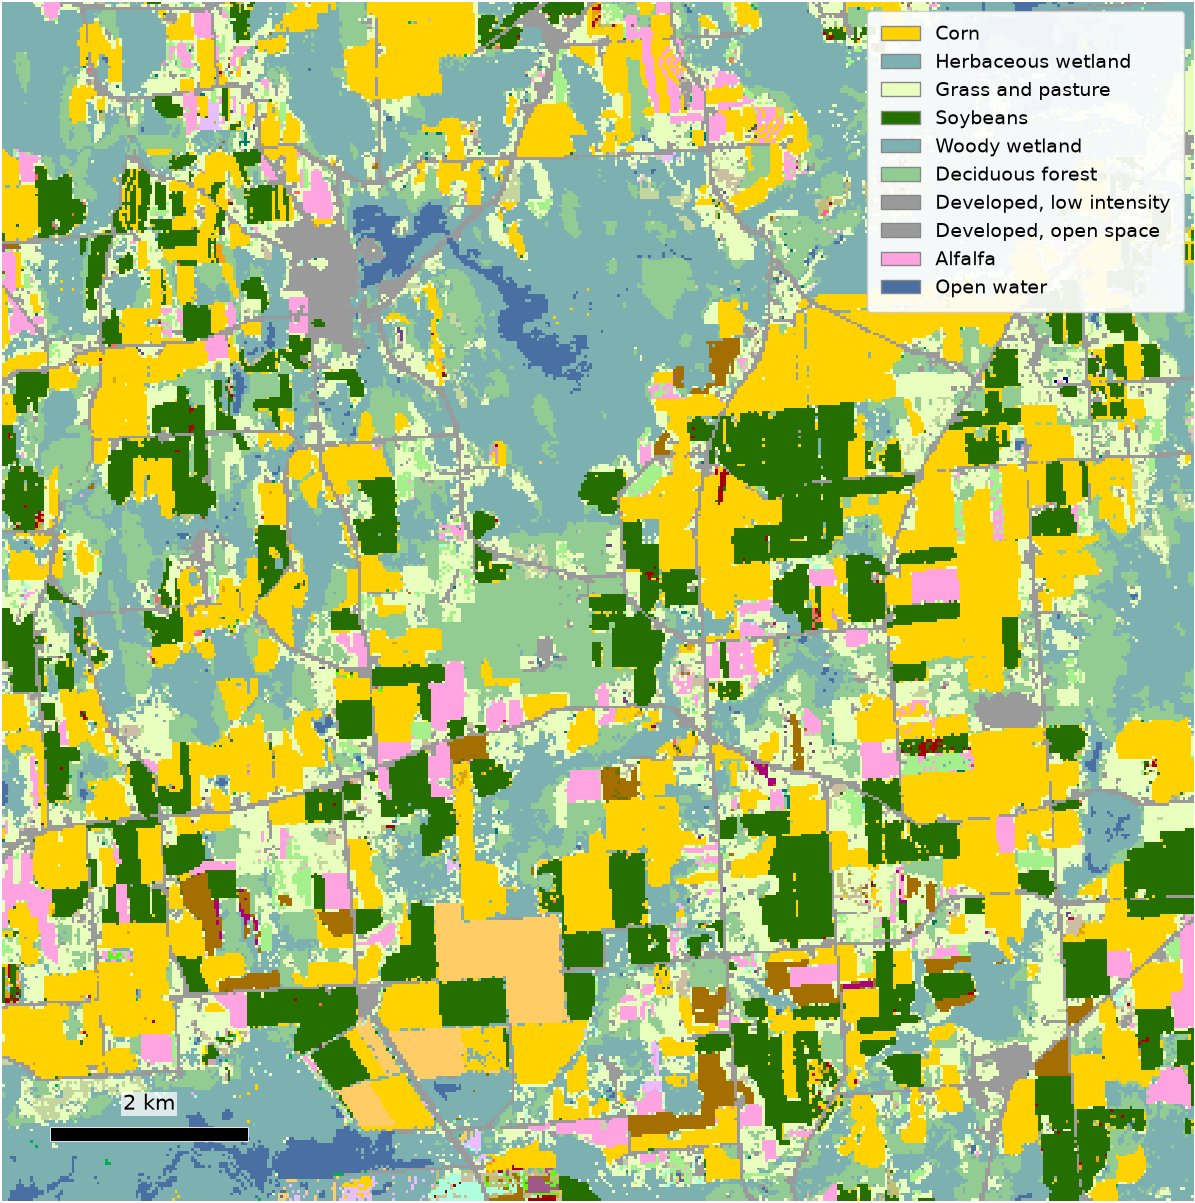
An annual crop-specific land cover layer, produced from satellite imagery and extensive agricultural ground reference data collected through the growing season. Resolution is 10 m from the 2024 crop year and 30 m for 2008 to 2023. The release carries the share of the parcel in cultivated cropland and the single crop class covering the most of it. The publisher does not warrant any conclusions drawn from the data.
Readings and coverage
The share of parcels in each state that carry a value for the reading.
- Cropland — a value on every parcel of all 8 states
Fields
| Field | Unit | Measured flag | Description |
|---|---|---|---|
cropland_crop_type | cropland_coverage | The numeric class code covering the most of the parcel. | |
cropland_crop_pct | fraction 0–1 | cropland_coverage | The share of the parcel in its largest mapped crop class. |
cropland_fraction | fraction 0–1 | cropland_coverage | The share of the parcel in cultivated cropland. |
cropland_crop_name | cropland_coverage | The name of that class. | |
cropland_coverage | | Whether cropland was measured on this parcel, or the source does not cover it. |
Forest and canopy height
- Resolution2 m lidar, else 30 m
- Measured overThe woodland part of the parcel
- Time windowLidar flights 2012–2021
- UpdatedLand cover yearly; lidar as flown
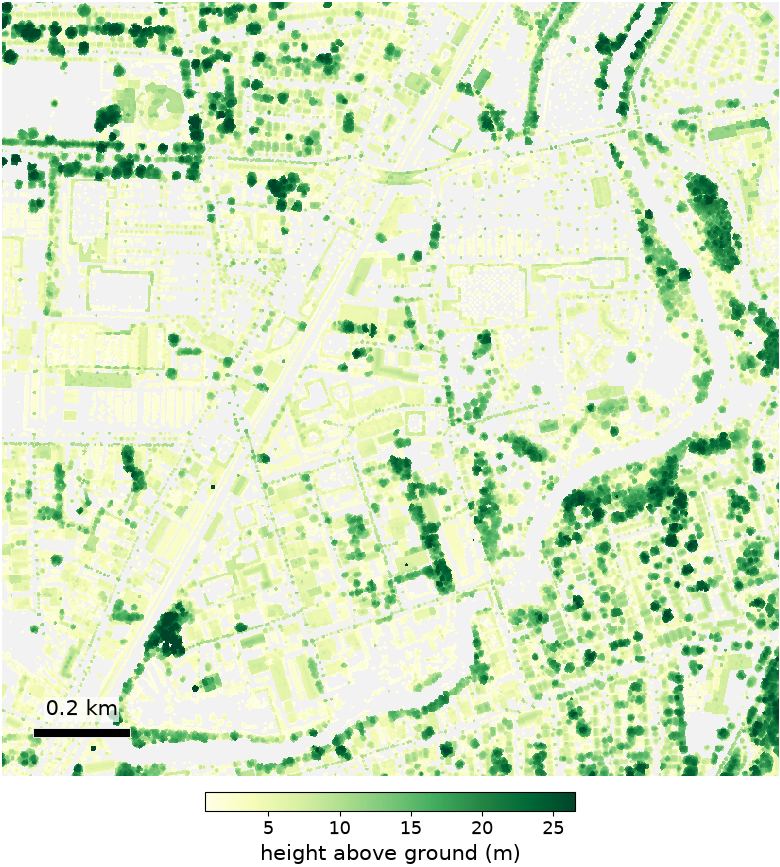
Two readings. Forest cover is the share of the parcel in the three forest classes of the land cover grid: areas dominated by trees generally greater than 5 metres tall covering more than 20 percent of the total vegetation. Canopy height is the average height of the top of the canopy for a stand, read from airborne lidar returns normalised to the ground surface where lidar has been flown, and from a 30 m modelled vegetation-height grid elsewhere; the release names which answered. Height is read only inside the mapped forest area.
Readings and coverage
The share of parcels in each state that carry a value for the reading.
- Forest cover — a value on every parcel of all 8 states
- Canopy height — CT 32% · DC 0.5% · FL 9% · MA 26% · MD 19% · MT 24% · NJ 14% · WI 35%
Fields
| Field | Unit | Measured flag | Description |
|---|---|---|---|
forest_fraction | fraction 0–1 | forest_coverage | Share of the parcel under forest land cover. |
forest_canopy_height_mean_m | m | forest_height_coverage | Mean canopy height over the parcel's mapped forest area; empty where no forest is mapped. |
forest_height_source | | Which height source answered: lidar, the modelled grid, or neither. | |
forest_coverage | | Whether forest cover was measured on this parcel, or the source does not cover it. | |
forest_height_coverage | | Whether canopy height was measured on this parcel, or the source does not cover it. |
Vegetation loss
- Resolution30 m
- Measured overThe vegetated part of the parcel
- Time window2023 onward, by year
- UpdatedYearly
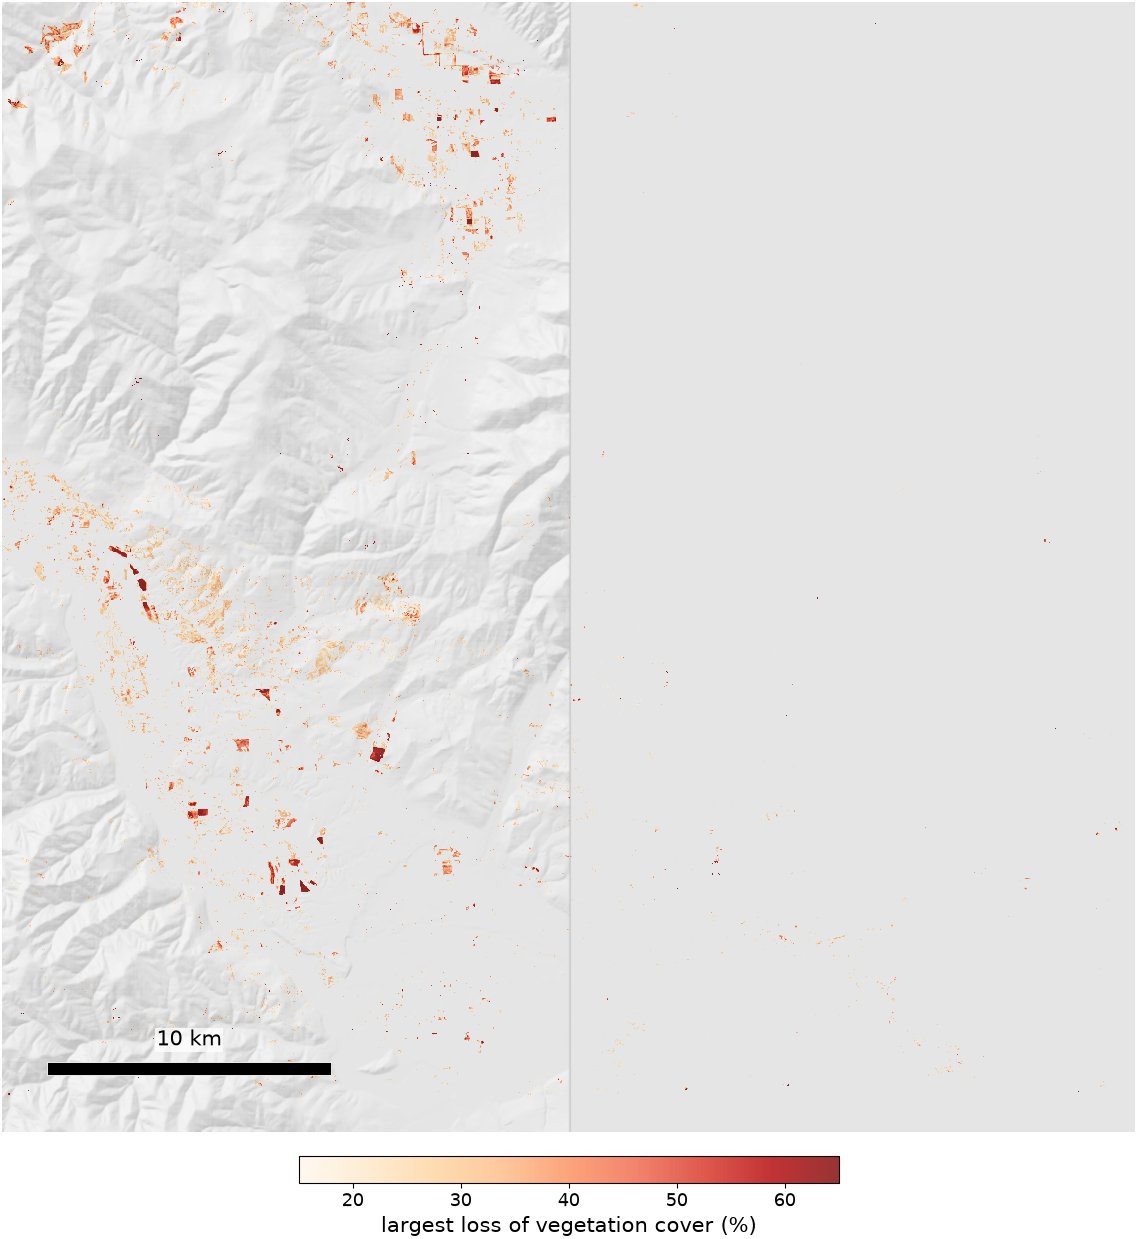
Vegetation disturbance, mapped where an indicated decrease in vegetation cover is seen within a 30 m cell. Only confirmed disturbances are reported, with the date of initial disturbance: a loss is confirmed from subsequent cloud-free observations that show the detection persists, so how quickly a loss appears depends on how often the ground is seen clearly. The layers record loss of vegetation cover; no cause is attributed.
Readings and coverage
The share of parcels in each state that carry a value for the reading.
- Vegetation loss — a value on every parcel of all 8 states
Fields
| Field | Unit | Measured flag | Description |
|---|---|---|---|
vegetation_disturbance_years_scanned | count | | Product years read for this parcel. |
vegetation_disturbance_latest_year | year | | The newest product year read. |
vegetation_disturbance_disturbed_fraction | fraction 0–1 | vegetation_disturbance_coverage | Share of the parcel's vegetated ground with a confirmed loss in the newest year. |
vegetation_disturbance_major_loss_fraction | fraction 0–1 | vegetation_disturbance_coverage | Share that lost half its vegetation cover or more in the newest year. |
vegetation_disturbance_ongoing_fraction | fraction 0–1 | vegetation_disturbance_coverage | Share still bare at the end of the newest year. |
vegetation_disturbance_last_loss_year | year | | Most recent year with a confirmed loss on the parcel. |
vegetation_disturbance_last_loss_fraction | fraction 0–1 | | Share of vegetated ground lost in that year. |
vegetation_disturbance_last_loss_date | date | | Earliest date a loss was detected in that year. |
vegetation_disturbance_max_loss_year | year | | Year with the largest share of the parcel under confirmed loss. |
vegetation_disturbance_max_loss_fraction | fraction 0–1 | | That largest share. |
vegetation_disturbance_max_loss_pct | percent 0–100 | | Largest loss of cover on any single 30 m cell, in any year read. |
vegetation_disturbance_coverage | | Whether vegetation loss was measured on this parcel, or the source does not cover it. |
Carbon and biomass
- Resolution30 m trees, 10 m soil
- Measured overThe forested part of the parcel
- Time windowTrees 2023, biomass 2014–2018, soil 2020
- UpdatedIrregular
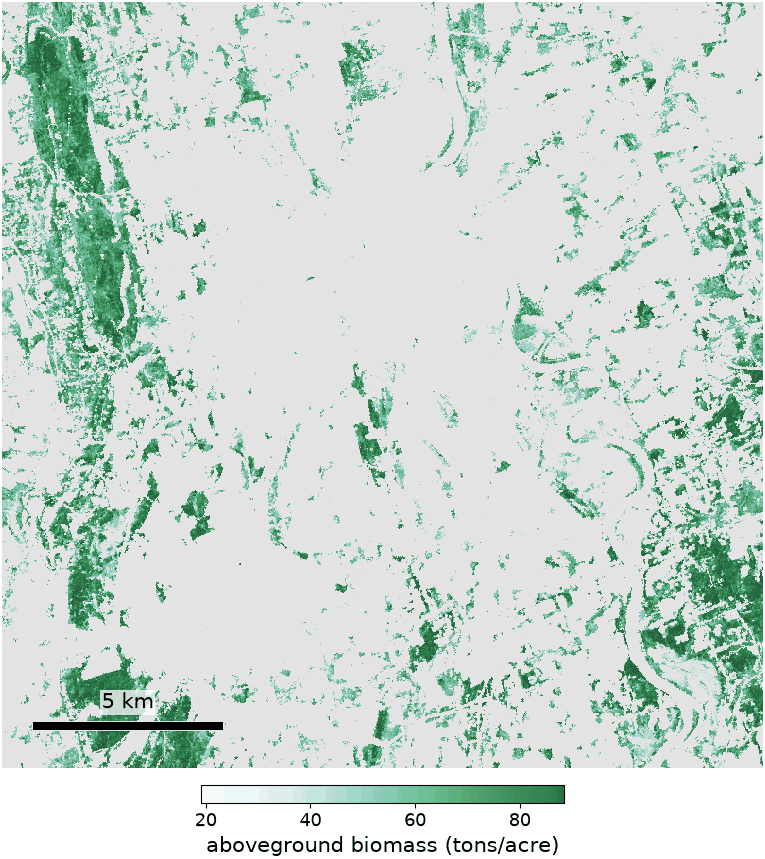
Three readings, each from a separate model and never blended. Tree carbon — live above ground, standing dead, and down dead wood more than 3 inches in diameter — is in tons per acre, from a 30 m model that imputes a measured forest inventory plot to each forested cell. Aboveground biomass, also tons per acre, is from a separate 30 m model built by matching satellite imagery from 2014 to 2018 to about 213,000 field plots measured in the same period. Soil organic carbon is the stock estimated for the top metre of the soil map unit. The publishers state that these are modelled estimates and a snapshot that changes over time.
Readings and coverage
The share of parcels in each state that carry a value for the reading.
- Tree carbon — CT 33% · DC 0.8% · FL 15% · MA 30% · MD 22% · MT 36% · NJ 18% · WI 44%
- Aboveground biomass — CT 34% · DC 2% · FL 18% · MA 31% · MD 27% · MT 27% · NJ 19% · WI 41%
- Soil organic carbon — CT 100% · DC 91% · FL 100% · MA 87% · MD 96% · MT 98% · NJ 100% · WI 94%
Fields
| Field | Unit | Measured flag | Description |
|---|---|---|---|
carbon_live_mean | tons/acre | carbon_coverage | Live-tree carbon per forested acre (imputed 30 m model) |
carbon_dead_mean | tons/acre | carbon_coverage | Standing-dead carbon per forested acre (imputed 30 m model) |
carbon_down_mean | tons/acre | carbon_coverage | Down-dead carbon per forested acre (imputed 30 m model) |
carbon_agb_total_mean | tons/acre | carbon_agb_coverage | Aboveground biomass per forested acre (imputed 30 m model) |
carbon_soc_mean | g C/m² | carbon_soc_coverage | Mean soil organic carbon, 0–100 cm |
carbon_source | | Which model produced the carbon numbers. | |
carbon_covered_fraction | fraction 0–1 | carbon_coverage | Share of the parcel carrying modelled forest pixels (the area the carbon means are per acre of) |
carbon_agb_covered_fraction | fraction 0–1 | carbon_agb_coverage | Share of the parcel carrying modelled forest pixels (the area the biomass mean is per acre of) |
carbon_soc_covered_fraction | fraction 0–1 | carbon_soc_coverage | Share of the parcel with a rated soil map unit (the area the soil carbon mean is per acre of) |
carbon_coverage | | Whether tree carbon was measured on this parcel, or the source does not cover it. | |
carbon_agb_coverage | | Whether aboveground biomass was measured on this parcel, or the source does not cover it. | |
carbon_soc_coverage | | Whether soil organic carbon was measured on this parcel, or the source does not cover it. |
Soil
- Resolution10 m map units
- Measured overWhole parcel boundary
- Time window2020 survey build
- UpdatedIrregular
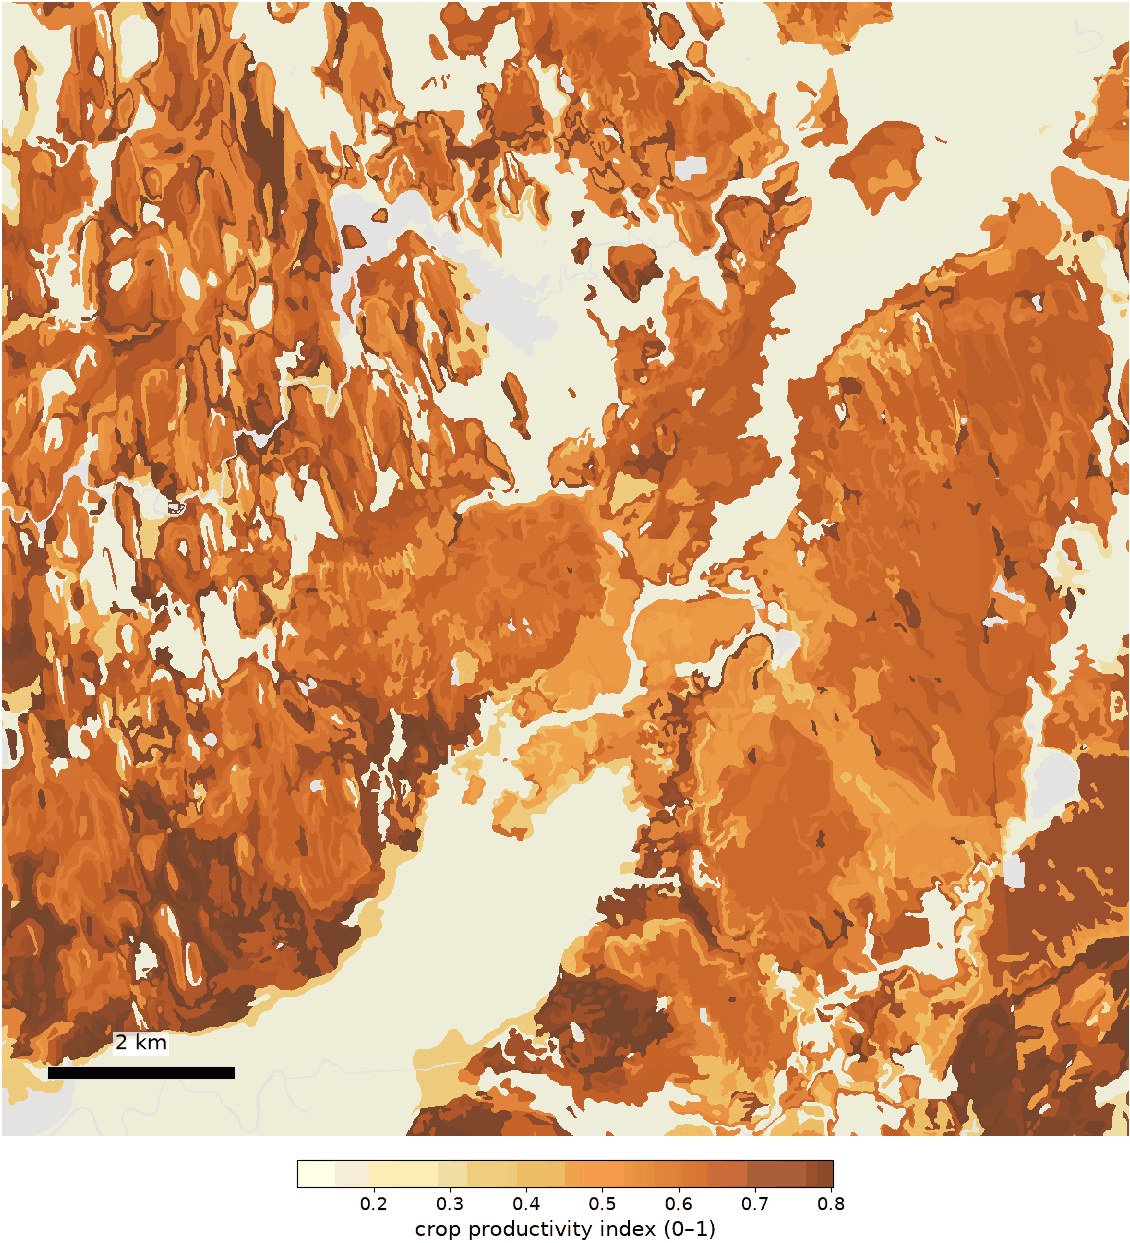
Soil properties and interpretations for the soil map unit under the parcel, read from the national gridded soil database: detailed field-validated soil survey mapping, filled with a general soil map where detailed mapping does not exist. Ratings describe the map unit at survey scale, not a sample taken on the parcel, and the publisher states that onsite investigation may be needed to validate the interpretations and to confirm the identity of the soil on a given site.
Readings and coverage
The share of parcels in each state that carry a value for the reading.
- Soil — a value on every parcel of all 8 states
Land capability class: the classes
| Code | Class | Definition |
|---|---|---|
1 | 1: few limits on use | Soils have few limitations that restrict their use. |
2 | 2: moderate limits | Soils have moderate limitations that reduce the choice of plants or that require moderate conservation practices. |
3 | 3: severe limits | Soils have severe limitations that reduce the choice of plants or that require special conservation practices, or both. |
4 | 4: very severe limits | Soils have very severe limitations that reduce the choice of plants or that require very careful management, or both. |
5 | 5: not suited to crops, little erosion | Soils are subject to little or no erosion but have other limitations, impractical to remove, that restrict their use mainly to pasture, rangeland, forestland or wildlife habitat. |
6 | 6: not suited to crops, severe limits | Soils have severe limitations that make them generally unsuitable for cultivation and that restrict their use mainly to pasture, rangeland, forestland or wildlife habitat. |
7 | 7: not suited to crops, very severe limits | Soils have very severe limitations that make them unsuitable for cultivation and that restrict their use mainly to grazing, forestland or wildlife habitat. |
8 | 8: not for commercial plants | Soils and miscellaneous areas have limitations that preclude commercial plant production and that restrict their use to recreational purposes, wildlife habitat, watershed or aesthetic purposes. |
Fields
| Field | Unit | Measured flag | Description |
|---|---|---|---|
soil_nccpi3all_mean | index 0–1 | | Crop productivity index, all crops; blank where the soil survey publishes none. |
soil_mukey | soil_coverage | The soil map unit key covering the most of the parcel. | |
soil_mukey_fraction | fraction 0–1 | soil_coverage | Share of parcel in its main soil map unit |
soil_map_unit_name | soil_coverage | Name of that map unit. | |
soil_drainage_class | | Natural drainage class of that map unit: the frequency and duration of wet periods under the conditions in which the soil formed, in seven classes from excessively drained to very poorly drained. | |
soil_hydrologic_group | | Hydrologic soil group of that map unit, A to D plus dual classes: runoff potential, from how fast water infiltrates when the soil is bare and thoroughly wet. A infiltrates fastest, D slowest. | |
soil_hydric_pct | % | soil_coverage | Share of parcel in hydric soil |
soil_capability_class | class | | Land capability class (1 best – 8); blank where the soil survey publishes none. |
soil_farmland_class | | Farmland classification of that map unit: prime farmland, farmland of statewide or local importance, or unique farmland. It identifies the soils best suited to food, feed, fibre, forage and oilseed crops. | |
soil_bedrock_depth_min_cm | cm | | Shallowest depth to bedrock; blank where the soil survey reports no bedrock. |
soil_water_table_depth_min_cm | cm | | Shallowest annual water table; blank where the soil survey reports none. |
soil_flood_frequency | | Flooding frequency class of that map unit: none, very rare, rare, occasional, frequent or very frequent. Flooding is temporary inundation by overflowing streams, runoff from slopes, or tides. | |
soil_septic_limitation | soil_coverage | Limitation rating of that map unit for a septic tank absorption field, judged on the soil between 24 and 60 inches deep: not limited, somewhat limited or very limited. | |
soil_basement_limitation | soil_coverage | Limitation rating of that map unit for a single-family dwelling of three storeys or less with a basement, assuming footings about 7 feet down: not limited, somewhat limited or very limited. | |
soil_slope_pct | % | | Area-weighted slope of the main map unit. |
soil_coverage | | Whether soil was measured on this parcel, or the source does not cover it. |
Ground failure
- Resolution90 m terrain, 925 m site class
- Measured overWhole parcel boundary, and distances from it
- Time windowFaults 2020, terrain 2024
- UpdatedIrregular
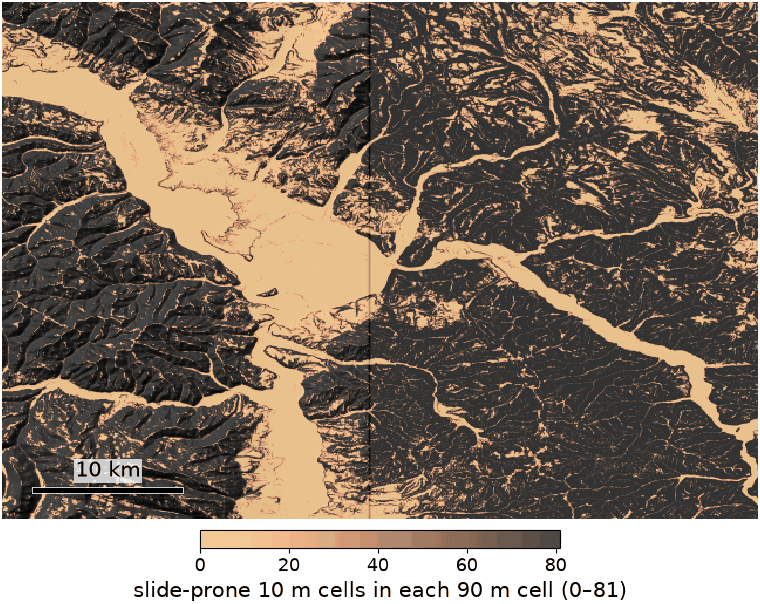
Nine readings about ground that may move. Slide-prone terrain comes from a 90 m national model of slope and 100 m relief trained on 613,724 mapped landslides, which captures 98.9 percent of observed landslides within terrain covering 44.6 percent of the area. Mapped landslides, sinkholes, karst geology and underground mine workings are compiled from inventories kept jurisdiction by jurisdiction, which the publisher states vary greatly in quality, accessibility and extent. The set also carries measured vertical ground movement, the nearest Quaternary fault with its age and slip-rate class, the seismic site class from the time-averaged shear-wave velocity in the upper 30 m of the ground, and a modelled probability of permafrost within 1 m of the surface, whose overall map accuracy the publisher puts at about 85 percent.
Readings and coverage
The share of parcels in each state that carry a value for the reading.
- Slide-prone terrain — a value on every parcel of all 8 states
- Quaternary faults — CT 0% · DC 0% · FL 0% · MA 0% · MD 0% · MT 53% · NJ 0% · WI 0%
- Mapped landslides — CT 0.1% · DC 0.4% · FL 0.0% · MA 0.1% · MD 0.2% · MT 0.2% · NJ 2% · WI 0.1%
- Underground mine workingsNo parcel in any published state carries a value: these layers are published state by state, and no state in this release has one.
- Near-surface permafrostNo parcel in any published state carries a value: these layers are published state by state, and no state in this release has one.
- Mapped sinkholesNo parcel in any published state carries a value: these layers are published state by state, and no state in this release has one.
- Karst geologyNo parcel in any published state carries a value: these layers are published state by state, and no state in this release has one.
- Seismic site class — a value on every parcel of all 8 states
- Ground subsidenceNo parcel in any published state carries a value: these layers are published state by state, and no state in this release has one.
Confidence in nearest landslide: the classes
| Code | Meaning |
|---|---|
1 | 1: possible landslide in the area |
2 | 2: probable landslide in the area |
3 | 3: likely landslide at or near here |
5 | 5: moderate confidence in its extent |
8 | 8: high confidence in its extent |
Sinkhole geology class: the classes
| Code | Meaning |
|---|---|
1 | 1: least favourable |
2 | 2 |
3 | 3 |
4 | 4: most favourable |
Worst sinkhole geology class: the classes
| Code | Meaning |
|---|---|
1 | 1: least favourable |
2 | 2 |
3 | 3 |
4 | 4: most favourable |
Fields
| Field | Unit | Measured flag | Description |
|---|---|---|---|
ground_failure_susceptible_fraction | fraction 0–1 | ground_failure_coverage | Share of the parcel that is landslide-susceptible terrain (slope-relief model, 90 m cells) |
ground_failure_susceptible_max_cell_fraction | fraction 0–1 | ground_failure_coverage | Most susceptible 90 m cell on the parcel, as its share of slide-prone terrain (same model) |
ground_failure_susceptibility_model | | Which terrain model the susceptibility shares come from. | |
ground_failure_landslide_on_parcel | ground_failure_inventory_coverage | A mapped landslide point or deposit touches the parcel | |
ground_failure_landslides_within_500m | count | ground_failure_inventory_coverage | Mapped landslides within 500 m (uneven survey, no record does not mean none) |
ground_failure_landslide_nearest_confidence | code | ground_failure_inventory_coverage | Survey confidence in the nearest mapped landslide, 1 (possible, somewhere near) to 8 (high) |
ground_failure_landslide_distance_m | | Distance to the nearest mapped landslide. | |
ground_failure_fault_distance_m | m | ground_failure_fault_coverage | Distance to the nearest mapped Quaternary fault trace within 50 km |
ground_failure_fault_name | ground_failure_fault_coverage | Name of the nearest mapped fault. | |
ground_failure_fault_age | ground_failure_fault_coverage | Age class of that fault's most recent movement. | |
ground_failure_fault_slip_rate | ground_failure_fault_coverage | Slip-rate class of that fault. | |
ground_failure_fault_class | ground_failure_fault_coverage | Fault class of that trace: A, B or C. | |
ground_failure_fault_mapped_scale | ground_failure_fault_coverage | Map scale the trace was drawn at. | |
ground_failure_fault_mapped_certainty | ground_failure_fault_coverage | How confidently the trace was located. | |
ground_failure_vs30_ms | m/s | ground_failure_site_coverage | Top-30 m shear-wave velocity, parcel mean (~925 m cells, often slope-inferred) |
ground_failure_vs30_sd_ms | ln units | ground_failure_site_coverage | Spread of that shear-wave speed, as a natural-log standard deviation rather than m/s. |
ground_failure_site_class | ground_failure_site_coverage | Seismic site class of that ground, from the time-averaged shear-wave velocity in the upper 30 m: A at 1500 m/s and above, B at 760, C at 360, D at 180, E below. | |
ground_failure_sinkhole_on_parcel | ground_failure_sinkhole_coverage | A mapped sinkhole touches the parcel. | |
ground_failure_sinkholes_within_500m | count | ground_failure_sinkhole_coverage | Mapped sinkholes within 500 m of the parcel. |
ground_failure_sinkhole_distance_m | | Distance to the nearest mapped sinkhole. | |
ground_failure_sinkhole_nearest_verified | ground_failure_sinkhole_coverage | Whether the nearest record was field-verified, where the survey records that. | |
ground_failure_sinkhole_source | | Which survey's layer answered. Empty where the state publishes none. | |
ground_failure_sinkhole_geology_class | class 1–4 | ground_failure_sinkhole_geology_coverage | Geology class covering the most of the parcel, 1 least to 4 most favourable for sinkhole formation. |
ground_failure_sinkhole_geology_worst_class | class 1–4 | ground_failure_sinkhole_geology_coverage | Most sinkhole-favourable geology class anywhere on the parcel (the same mapping) |
ground_failure_over_mapped_mined_area | ground_failure_mine_coverage | Part of the parcel lies over a mapped underground working. False means no mapped working. | |
ground_failure_mined_area_fraction | fraction 0–1 | ground_failure_mine_coverage | Share of the parcel over mapped underground workings |
ground_failure_mined_area_distance_m | | Distance to the nearest mapped underground working. Empty beyond 5 km. | |
ground_failure_mine_name | | Name of the nearest mapped working. Empty beyond 5 km. | |
ground_failure_mine_type | | Mining method of that working. Empty beyond 5 km. | |
ground_failure_mine_status | | Status of that working as published. Empty beyond 5 km. | |
ground_failure_coal_seam | | Coal seam of that working. Empty beyond 5 km. | |
ground_failure_mine_extent_known | | False where mining is recorded here without its extent. Empty beyond 5 km. | |
ground_failure_mine_source | | Which state agency's layer answered. Empty where the state publishes none. | |
ground_failure_subsidence_total_ft | ft | ground_failure_subsidence_coverage | Vertical ground movement since June 2015, averaged over the parcel. Negative is sinking. |
ground_failure_subsidence_rate_ft_yr | ft/yr | ground_failure_subsidence_coverage | Vertical ground movement over the latest twelve months (InSAR); negative is sinking |
ground_failure_subsidence_period | ground_failure_subsidence_coverage | The dates the two subsidence numbers cover. | |
ground_failure_permafrost_probability | percent 0–100 | ground_failure_permafrost_coverage | Modelled probability of permafrost within 1 m of the surface, over the parcel's assessed ground. |
ground_failure_permafrost_class | ground_failure_permafrost_coverage | Permafrost likelihood from the modelled probability: unlikely under 10%, possible 10–50%, likely 50–90%, very likely at 90% and above. | |
ground_failure_permafrost_unassessed_fraction | | Share of the parcel the permafrost model did not assess. | |
ground_failure_coverage | | Whether slide-prone terrain was measured on this parcel, or the source does not cover it. | |
ground_failure_inventory_coverage | | Whether mapped landslides was measured on this parcel, or the source does not cover it. | |
ground_failure_fault_coverage | | Whether quaternary faults was measured on this parcel, or the source does not cover it. | |
ground_failure_site_coverage | | Whether seismic site class was measured on this parcel, or the source does not cover it. | |
ground_failure_sinkhole_coverage | | Whether mapped sinkholes was measured on this parcel, or the source does not cover it. | |
ground_failure_sinkhole_geology_coverage | | Whether karst geology was measured on this parcel, or the source does not cover it. | |
ground_failure_mine_coverage | | Whether underground mine workings was measured on this parcel, or the source does not cover it. | |
ground_failure_subsidence_coverage | | Whether ground subsidence was measured on this parcel, or the source does not cover it. | |
ground_failure_permafrost_coverage | | Whether near-surface permafrost was measured on this parcel, or the source does not cover it. |
Wetland
- ResolutionVector, 1:24,000
- Measured overWhole parcel boundary
- Time windowPhotography 1972–2023, median 2010
- UpdatedTwice a year, project by project
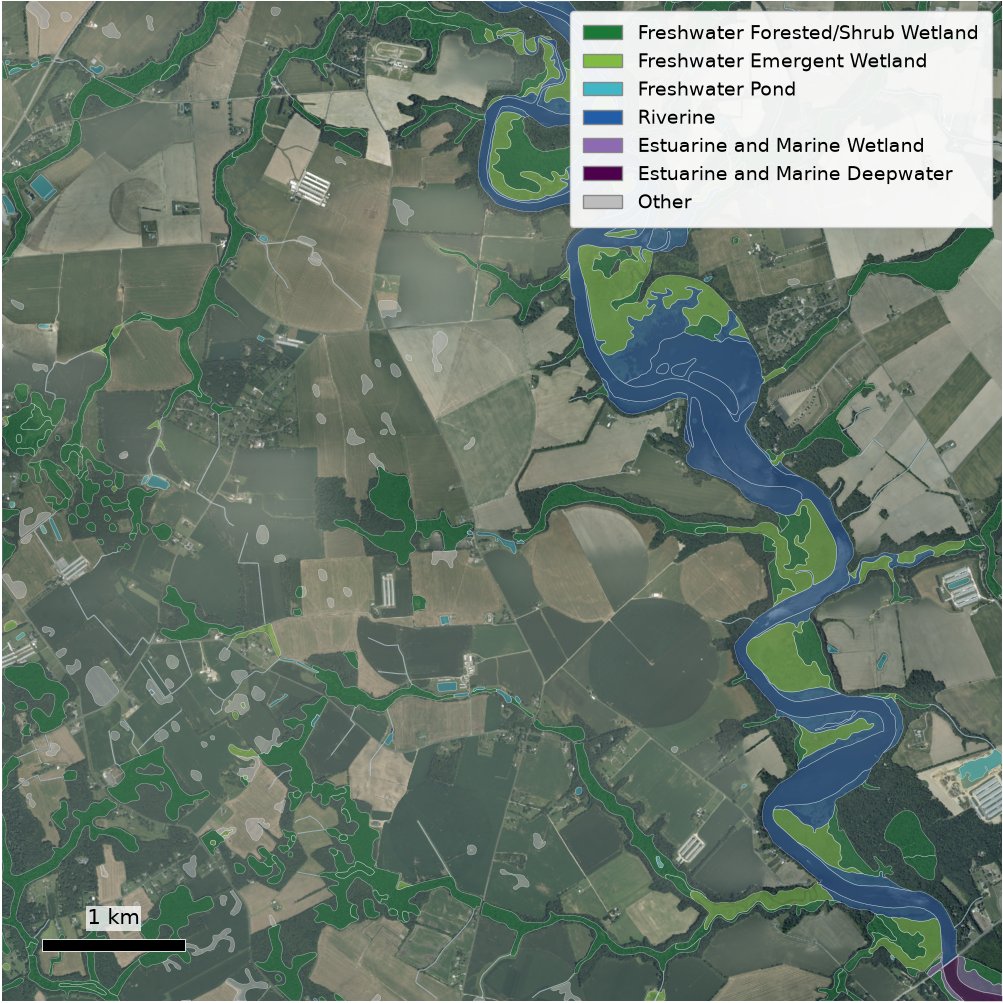
The share of the parcel inside mapped wetland and deepwater habitat polygons, interpreted from aerial photography at 1:24,000; open water is counted separately. The mapping records the extent, approximate location and type of wetlands under a biological definition of wetland. The publisher states that regulatory agencies with jurisdiction over wetlands may define and describe wetlands differently, and that no attempt is made to define the limits of proprietary jurisdiction of any government or the geographical scope of any regulatory programme.
Readings and coverage
The share of parcels in each state that carry a value for the reading.
- Wetland — a value on every parcel of all 8 states
Fields
| Field | Unit | Measured flag | Description |
|---|---|---|---|
wetland_fraction | fraction 0–1 | wetland_coverage | Share of the parcel in mapped wetland, open water excluded. |
wetland_open_water_fraction | fraction 0–1 | wetland_coverage | Share of the parcel in open water: lake, river or deepwater. |
wetland_coverage | | Whether wetland was measured on this parcel, or the source does not cover it. |
Water bodies
- ResolutionVector, traced from lidar
- Measured overFrom the parcel boundary
- Time windowAs of September 2024
- UpdatedYearly
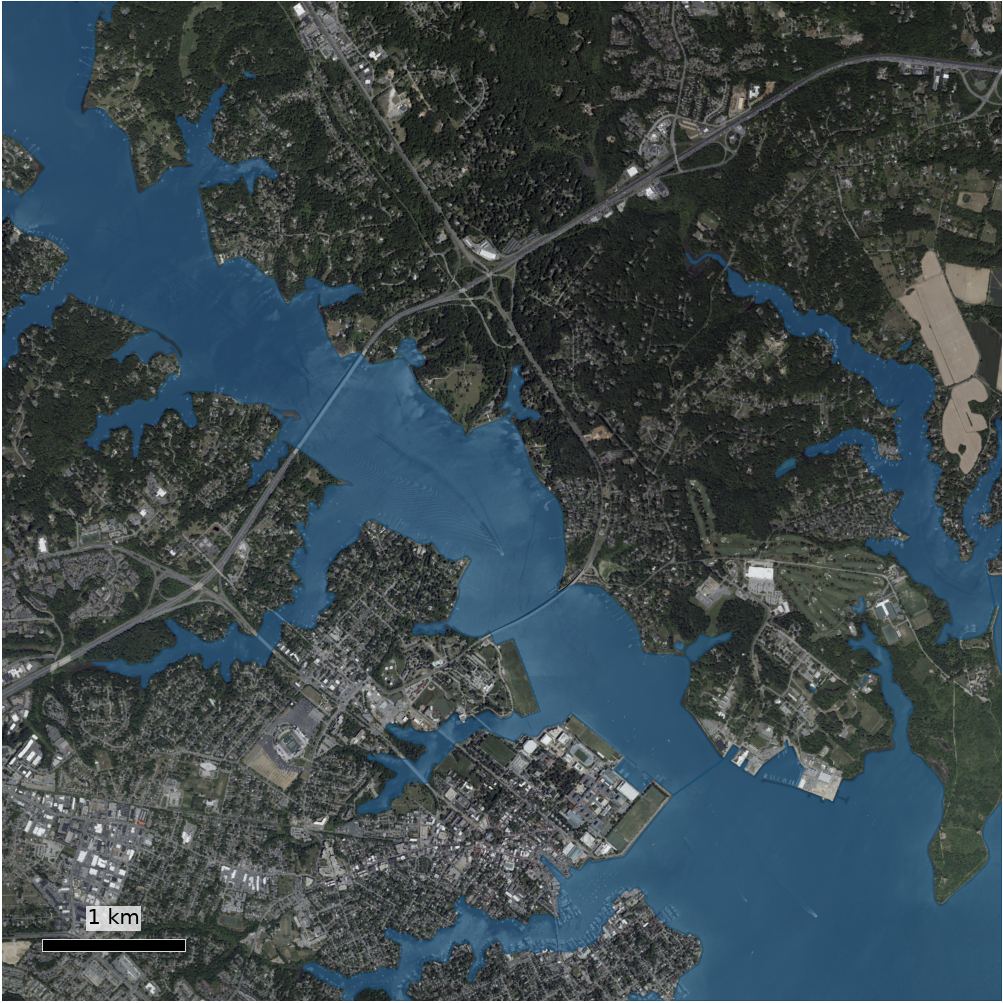
The distance from the parcel boundary to the nearest mapped lake, pond or wide river in the national hydrography layer. Features are traced from lidar elevation data where an area has been remapped; where it has not, the layer carries the older 1:24,000 geometry, tagged as such, so accuracy varies by area. A parcel on the shore reads zero.
Readings and coverage
The share of parcels in each state that carry a value for the reading.
- Water bodies — a value on every parcel of all 8 states
Fields
| Field | Unit | Measured flag | Description |
|---|---|---|---|
waterfront_waterbody_distance_m | m | waterfront_coverage | Distance to the nearest mapped water body. |
waterfront_coverage | | Whether water bodies was measured on this parcel, or the source does not cover it. |
Streams
- ResolutionVector, traced from lidar
- Measured overFrom the parcel boundary
- Time windowAs of September 2024
- UpdatedYearly
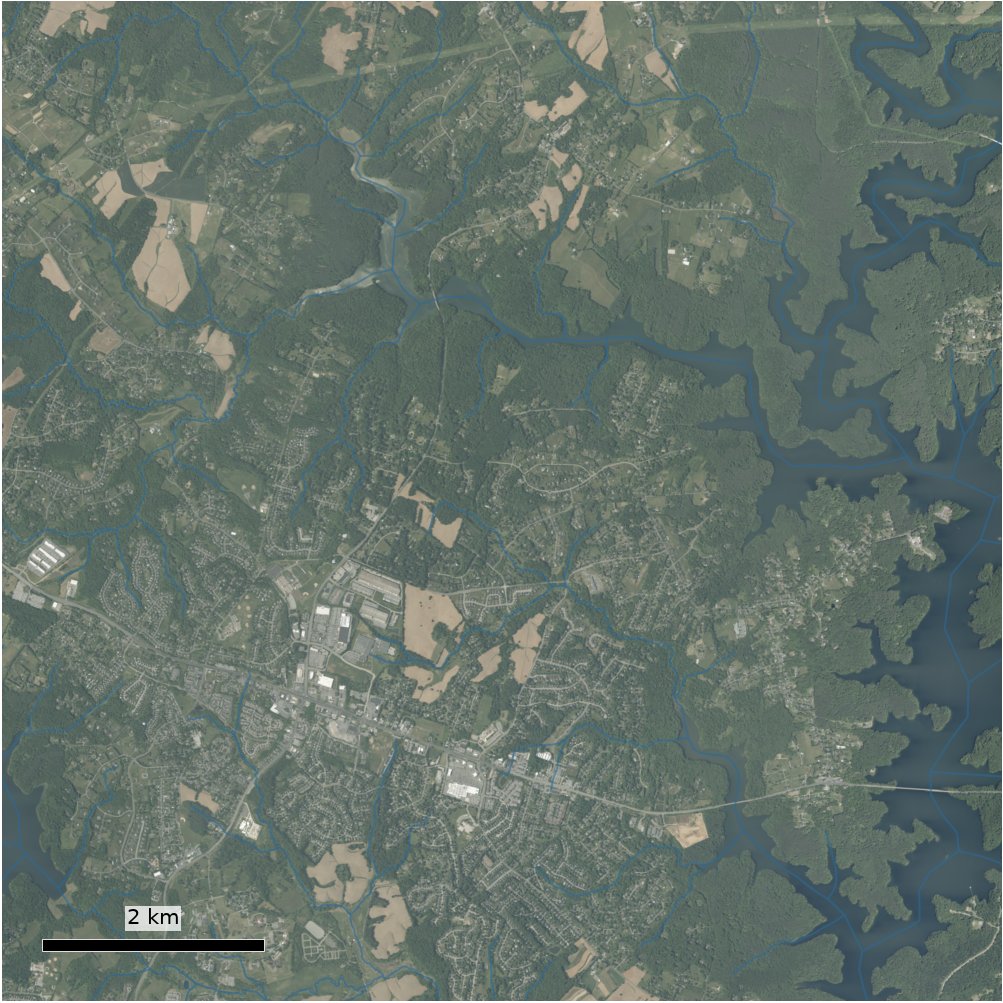
The distance from the parcel boundary to the nearest mapped stream in the national hydrography layer. Features are traced from lidar elevation data where an area has been remapped; where it has not, the layer carries the older 1:24,000 geometry, tagged as such, so what counts as a mapped stream varies by area.
Readings and coverage
The share of parcels in each state that carry a value for the reading.
- Streams — a value on every parcel of all 8 states
Fields
| Field | Unit | Measured flag | Description |
|---|---|---|---|
hydro_stream_distance_m | m | hydro_coverage | Distance to the nearest stream channel. Canals, drainageways and lake crossings are not counted. |
hydro_coverage | | Whether streams was measured on this parcel, or the source does not cover it. |
Hydro power siting
- Resolution10 m elevation
- Measured overThe nearest stream reach
- Time windowElevation sources to 2020
- UpdatedAs elevation is reflown
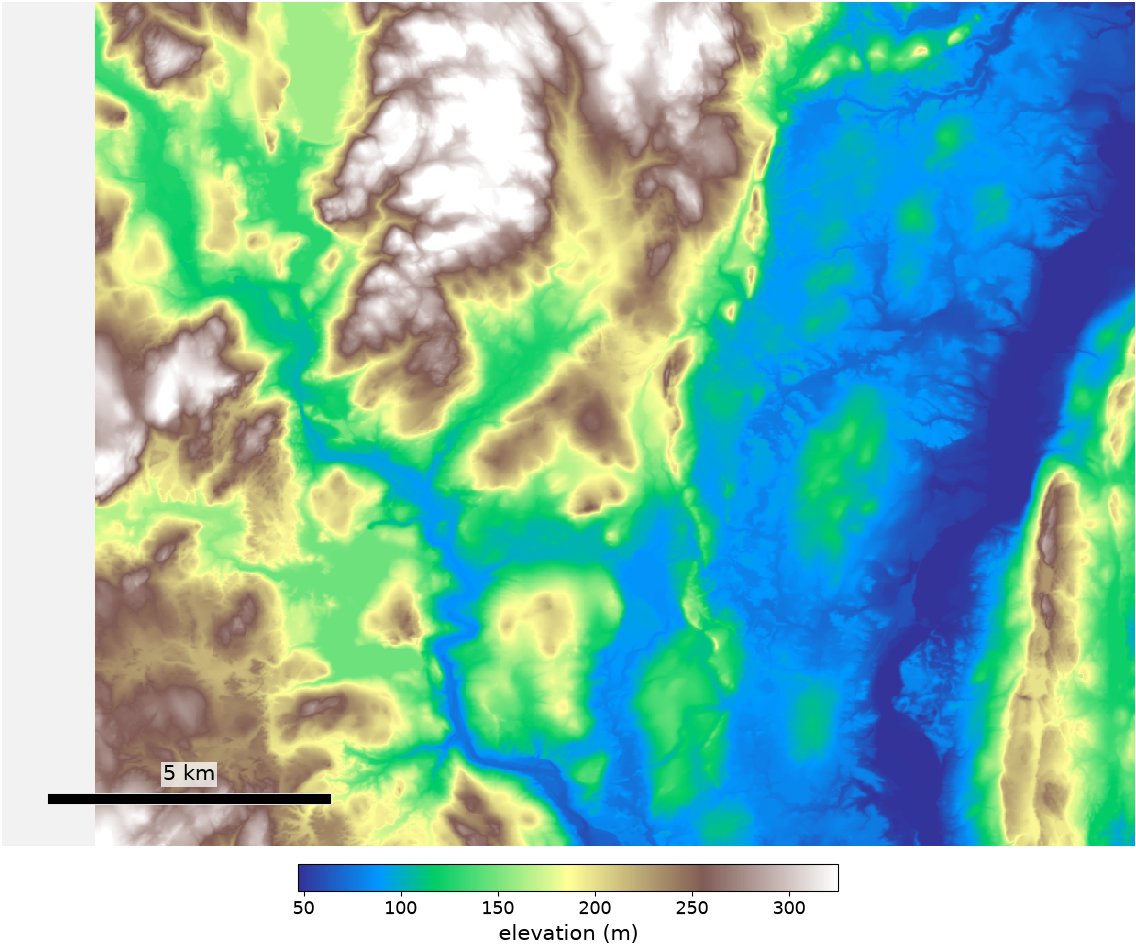
The stream nearest the parcel, how steeply it falls, and the length of stream over which that fall was measured. Gradient is the drop along the sampled stretch divided by its length, taken from a 10 m national elevation model. Under 300 m of sampled stream no gradient is reported and the length available is given instead.
Readings and coverage
The share of parcels in each state that carry a value for the reading.
- Distance to a stream — a value on every parcel of all 8 states
- Channel slope — CT 84% · DC 53% · FL 80% · MA 72% · MD 94% · MT 97% · NJ 56% · WI 91%
Fields
| Field | Unit | Measured flag | Description |
|---|---|---|---|
hydro_siting_stream_distance_m | m | hydro_siting_coverage | Distance to nearest stream channel, siting read (channel lines only; same rule as Streams) |
hydro_siting_channel_slope_pct | % | hydro_siting_slope_coverage | Slope of the nearest stream channel, sampled up to 1 km along it. |
hydro_siting_elev_drop_m | m | hydro_siting_slope_coverage | Elevation drop along the nearest stream in the sampled window. |
hydro_siting_sample_span_m | m | hydro_siting_slope_coverage | Length of stream actually sampled for the slope. |
hydro_siting_coverage | | Whether distance to a stream was measured on this parcel, or the source does not cover it. | |
hydro_siting_slope_coverage | | Whether channel slope was measured on this parcel, or the source does not cover it. |
Water depth
- ResolutionVector survey footprints
- Measured overFrom the parcel boundary
- Time windowChannels to 2026; lakes 1959–2010
- UpdatedChannels continuously
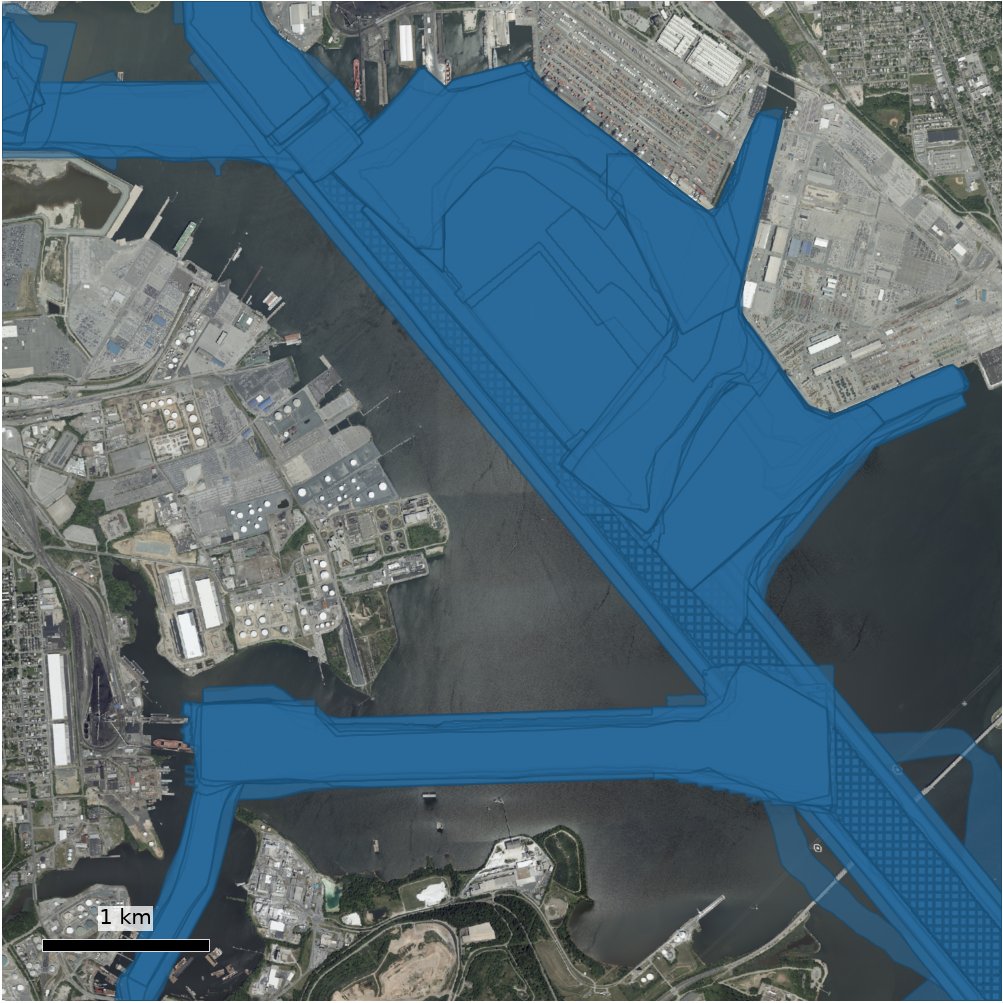
Two readings. The distance to the nearest surveyed navigation channel, measured to the outer boundary of a completed channel survey. And, where a surveyed lake lies within 500 m, that lake's name, its depth at the point nearest the parcel, its deepest surveyed point and the year of the survey, read from mapped bathymetric contours.
Readings and coverage
The share of parcels in each state that carry a value for the reading.
- Surveyed channels — CT 99% · DC 100% · FL 88% · MA 86% · MD 89% · MT 0% · NJ 97% · WI 48%
- Surveyed lakes — CT 100% · DC 0% · FL 0% · MA 0% · MD 0% · MT 0% · NJ 0% · WI 0%
Fields
| Field | Unit | Measured flag | Description |
|---|---|---|---|
water_depth_surveyed_channel_distance_m | m | water_depth_coverage | Distance to the nearest surveyed navigation channel. |
water_depth_lake_name | | The nearest surveyed lake within 500 m. | |
water_depth_lake_distance_m | | Distance to nearest surveyed lake (within 500 m); blank when none is that close. | |
water_depth_lake_depth_ft | | Surveyed depth of that lake at its nearest point to the parcel. | |
water_depth_lake_max_depth_ft | | Deepest surveyed point of that lake. | |
water_depth_lake_survey_year | | The year that lake was surveyed. | |
water_depth_lake_deepest_touched_ft | | Deepest surveyed band the parcel's own boundary reaches. | |
water_depth_coverage | | Whether surveyed channels was measured on this parcel, or the source does not cover it. | |
water_depth_lake_coverage | | Whether surveyed lakes was measured on this parcel, or the source does not cover it. |
Flood, surge, shaking and storms
- ResolutionVector zones; 625 m surge; banded shaking
- Measured overWhole parcel boundary, and distances from it
- Time windowStorms 1851 onward; flood maps in effect
- UpdatedFlood maps continuously; storms yearly
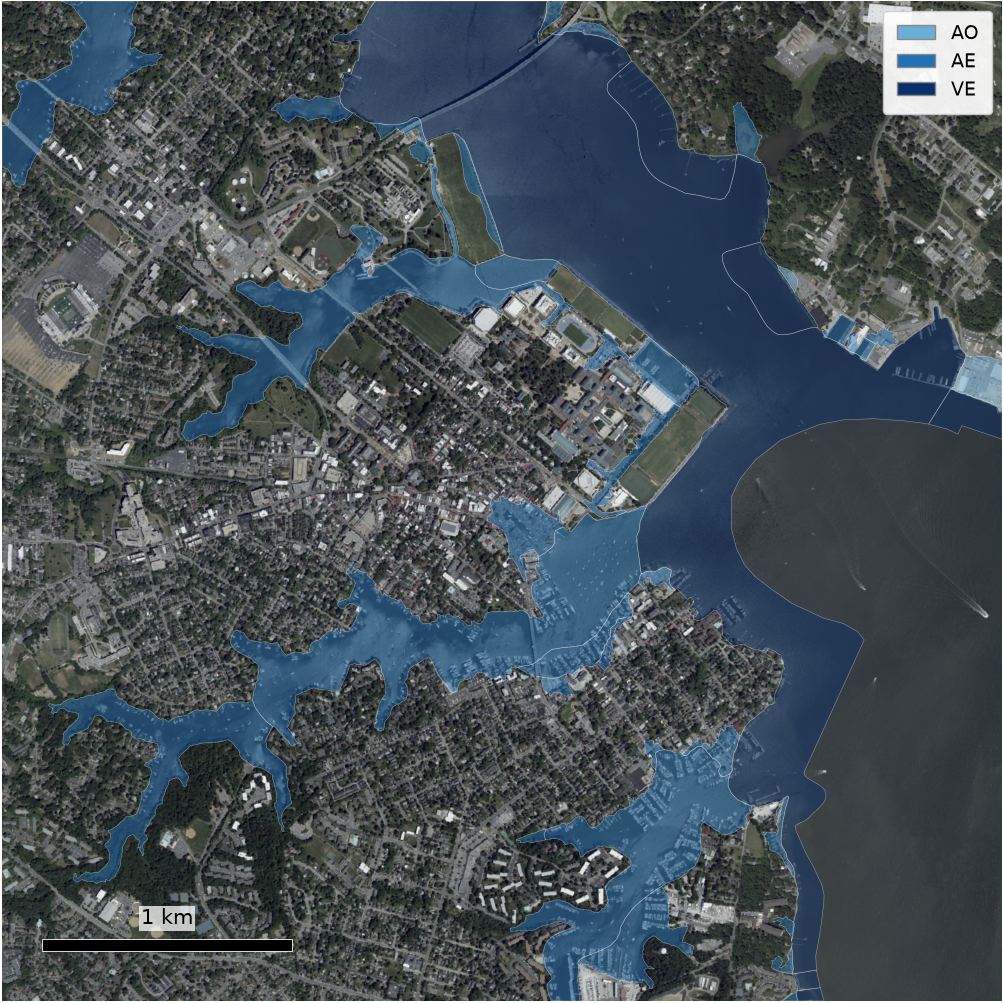
Five readings. Flood: the zone covering the most of the parcel, the share of it inside the area of special flood hazard — land subject to a 1 percent or greater chance of flooding in any given year — and the base flood elevation, the flood having a one percent chance of being equalled or exceeded in any given year. Storm surge: the lowest hurricane category whose modelled surge reaches the parcel and the deepest modelled water on it, from an ensemble that keeps the highest surge in each grid cell across up to 100,000 hypothetical storms per category, run at high tide, which the publisher describes as the near worst case under ideal storm conditions rather than a forecast. Shaking: peak ground acceleration with a 2 percent and a 10 percent chance of being exceeded in 50 years, for a firm-rock site. Hurricanes: six-hourly best-track positions of all known tropical and subtropical cyclones since 1851, counted within 50 km. Tornadoes: recorded damage paths since 1950, counted within 5 km.
Readings and coverage
The share of parcels in each state that carry a value for the reading.
- Flood zone — CT 87% · DC 100% · FL 99% · MA 93% · MD 100% · MT 73% · NJ 96% · WI 96%
- Hurricane tracks — a value on every parcel of all 8 states
- Ground shaking — CT 100% · DC 100% · FL 100% · MA 99% · MD 100% · MT 100% · NJ 100% · WI 100%
- Storm surge — CT 100% · DC 100% · FL 100% · MA 100% · MD 100% · MT 0% · NJ 100% · WI 98%
- Tornado paths — a value on every parcel of all 8 states
Weakest hurricane that floods it: the classes
| Code | Meaning |
|---|---|
1 | Category 1 |
2 | Category 2 |
3 | Category 3 |
4 | Category 4 |
5 | Category 5 |
Strongest tornado within 3 mi: the classes
| Code | Meaning |
|---|---|
0 | EF0 |
1 | EF1 |
2 | EF2 |
3 | EF3 |
4 | EF4 |
5 | EF5 |
Fields
| Field | Unit | Measured flag | Description |
|---|---|---|---|
hazard_flood_zone | hazard_coverage | The flood zone covering the most of the parcel, as the published flood map designates it. | |
hazard_flood_zone_subtype | | The zone subtype, where the published zone carries one. | |
hazard_sfha_fraction | fraction 0–1 | hazard_coverage | Share of the parcel inside the mapped 1%-annual-chance floodplain. |
hazard_flood_bfe_ft | | Base flood elevation (where one is published) | |
hazard_surge_min_category | | Weakest hurricane category whose surge reaches the parcel | |
hazard_surge_categories_modeled | | How many hurricane categories have a modelled surge grid here. | |
hazard_pga_2pct50_low_g | | Low edge of the ground-acceleration band with a 2% chance of being exceeded in 50 years. | |
hazard_pga_2pct50_high_g | | Peak ground acceleration, 2% in 50 years (band high edge) | |
hazard_pga_10pct50_low_g | | Low edge of the band with a 10% chance of being exceeded in 50 years. | |
hazard_pga_10pct50_high_g | | High edge of that 10%-in-50-years band. | |
hazard_storm_tracks_50km | count | hazard_hurricane_coverage | Recorded storm tracks within 50 km |
hazard_hurricane_tracks_50km | count | hazard_hurricane_coverage | Storms within 50 km at hurricane strength (64 kt+) at their closest recorded position |
hazard_max_wind_kt_50km | | Strongest wind among storms within 50 km, each read at its closest recorded position | |
hazard_last_storm_year_50km | | Year of the most recent recorded storm track within 50 km. | |
hazard_tornado_paths_5km | count | hazard_tornado_coverage | Recorded tornado paths within 5 km |
hazard_tornado_max_ef_5km | | Strongest tornado rating within 5 km | |
hazard_tornado_last_year_5km | | Year of the most recent recorded tornado path within 5 km. | |
hazard_tornado_on_parcel | hazard_tornado_coverage | A recorded tornado swath touches the parcel | |
hazard_surge_max_depth_low_ft | | Deepest modeled surge on the parcel, low edge of the modelled 1 ft band | |
hazard_surge_max_depth_high_ft | | Deepest modeled surge, high edge of that 1 ft band (blank for the open top band, over 20 ft) | |
hazard_coverage | | Whether flood zone was measured on this parcel, or the source does not cover it. | |
hazard_surge_coverage | | Whether storm surge was measured on this parcel, or the source does not cover it. | |
hazard_seismic_coverage | | Whether ground shaking was measured on this parcel, or the source does not cover it. | |
hazard_hurricane_coverage | | Whether hurricane tracks was measured on this parcel, or the source does not cover it. | |
hazard_tornado_coverage | | Whether tornado paths was measured on this parcel, or the source does not cover it. |
Wildfire hazard
- Resolution270 m
- Measured overWhole parcel boundary
- Time windowLandscape as of 2020
- UpdatedEvery two to three years
An index that quantifies the relative potential for high-intensity wildfire that may be difficult to manage, at 270 m, in five classes from very low to very high. The release carries the share of the parcel in the top two classes, the share that can burn at all, and the mean index; non-burnable ground and water are left out of the burnable share rather than scored low. The publisher states that on its own the index is not a map of wildfire threat or risk, is not a forecast for any particular season, reflects landscape conditions as of the end of 2020, and is not intended to replace a locally calibrated assessment.
Readings and coverage
The share of parcels in each state that carry a value for the reading.
- Wildfire hazard — a value on every parcel of all 8 states
- Wildfire hazard index — a value on every parcel of all 8 states
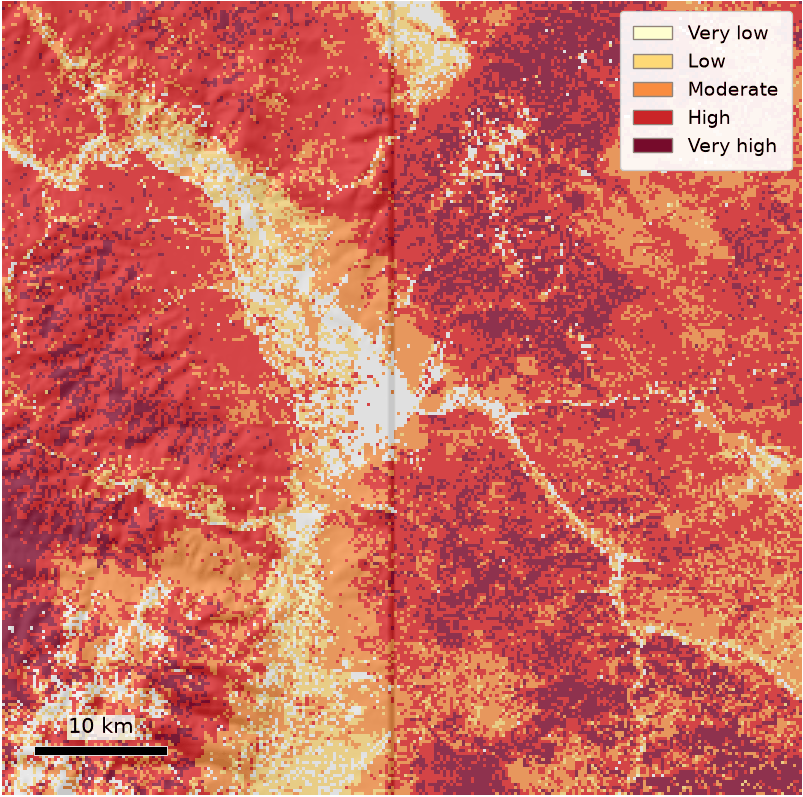
Hazard class: the classes
| Code | Meaning |
|---|---|
1 | Very low |
2 | Low |
3 | Moderate |
4 | High |
5 | Very high |
6 | Non-burnable |
7 | Water |
Fields
| Field | Unit | Measured flag | Description |
|---|---|---|---|
wildfire_whp_class | wildfire_coverage | Wildfire hazard class covering the most of the parcel, 1 very low to 5 very high. | |
wildfire_whp_class_label | wildfire_coverage | Name of that wildfire hazard class. | |
wildfire_whp_high_fraction | fraction 0–1 | wildfire_coverage | Share of the parcel in high or very high wildfire hazard |
wildfire_whp_burnable_fraction | fraction 0–1 | wildfire_coverage | Share of the parcel that can carry fire (hazard classes 1–5) |
wildfire_whp_index_mean | index | wildfire_index_coverage | Mean wildfire hazard index |
wildfire_coverage | | Whether wildfire hazard was measured on this parcel, or the source does not cover it. | |
wildfire_index_coverage | | Whether wildfire hazard index was measured on this parcel, or the source does not cover it. |
Fire history
- Resolution30 m
- Measured overWhole parcel boundary
- Time window1984–2024
- UpdatedYearly
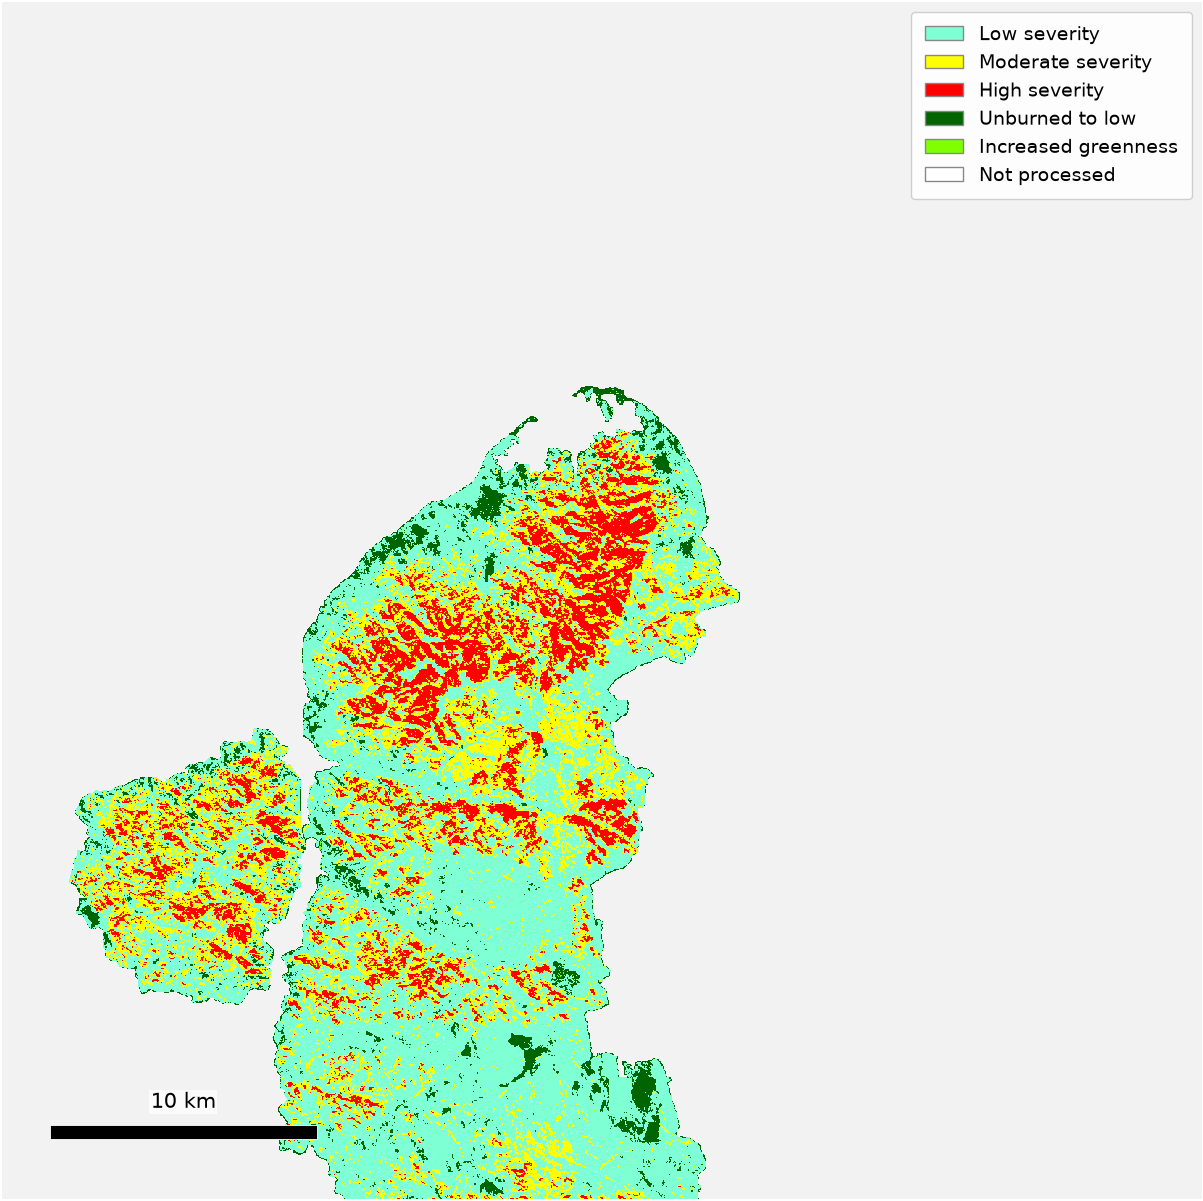
Whether the parcel has burned in a mapped fire since 1984, how often, in what year, at what severity class, and over what share of its area. The mapping programme assesses the frequency, extent and magnitude of large wildland fires — wildfires and prescribed fires reported as larger than 1,000 acres in the western United States and 500 acres in the eastern United States — at 30 m. Fires are omitted where suitable satellite imagery was not available or the burn was not discernible in it.
Readings and coverage
The share of parcels in each state that carry a value for the reading.
- Fire history — a value on every parcel of all 8 states
Fields
| Field | Unit | Measured flag | Description |
|---|---|---|---|
fire_years_scanned | years | | Years of burn mapping read for this state. |
fire_times_burned | count | fire_coverage | Number of recorded burns on the parcel in the burn-severity years scanned. |
fire_last_burn_year | | Year of the most recent burn; blank when no burn is recorded. | |
fire_last_burn_class | | Severity class of the most recent burn. Empty with no burn on record. | |
fire_last_burn_fraction | | Share of the whole parcel burned in the most recent burn; blank when no burn is recorded. | |
fire_max_severity_class | | Worst severity class on record. Empty with no burn on record. | |
fire_max_severity_year | | Year of the worst burn severity; blank when no burn is recorded. | |
fire_max_severity_fraction | | Share of the whole parcel at the worst burn severity; blank when no burn is recorded. | |
fire_coverage | | Whether fire history was measured on this parcel, or the source does not cover it. |
Climate
- Resolution4 km
- Measured overWhole parcel boundary
- Time window1991–2020 normals
- UpdatedOn the next normals period
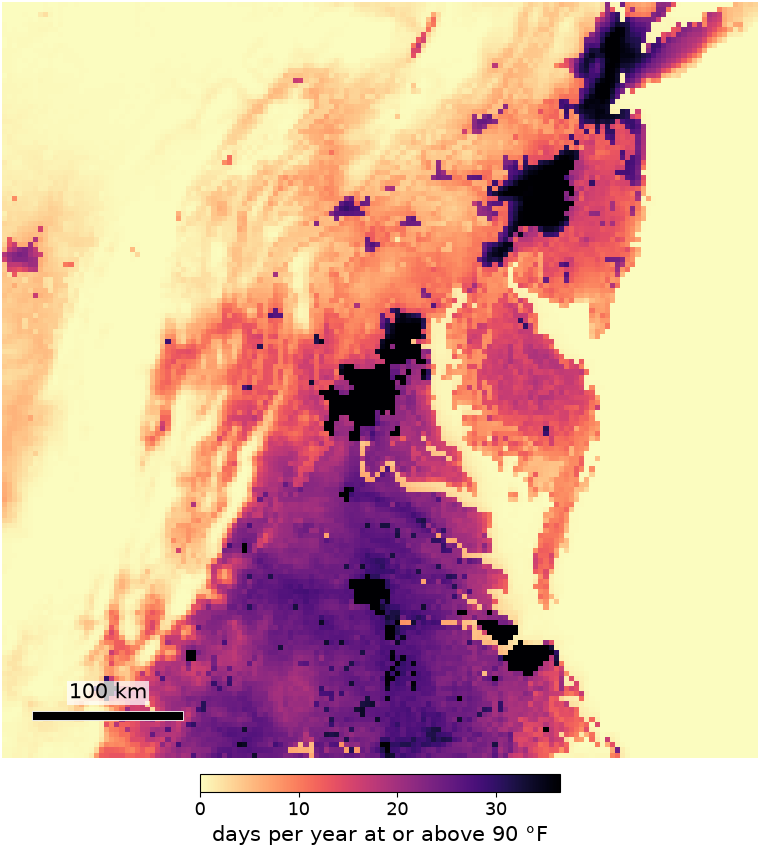
Thirty-year averages for 1991 to 2020, taken over the parcel from a 4 km regional hydroclimate reanalysis of historical conditions: the output of a regional weather model forced with a global reanalysis, with enough temporal and spatial detail to resolve mesoscale atmospheric processes. The readings are annual precipitation, mean air temperature, the warmest and coldest month, peak snow water equivalent, days at or above 90 °F, days at or below 32 °F, and the yearly peak wind.
Readings and coverage
The share of parcels in each state that carry a value for the reading.
- Climate normals — a value on every parcel of all 8 states
- Hot days, cold days and peak wind — a value on every parcel of all 8 states
Fields
| Field | Unit | Measured flag | Description |
|---|---|---|---|
climate_precip_annual_mm | mm | climate_coverage | Mean annual precipitation |
climate_temp_annual_c | °C | climate_coverage | Mean annual air temperature |
climate_temp_warm_month_c | °C | climate_coverage | Mean temperature of the warmest month |
climate_temp_cold_month_c | °C | climate_coverage | Mean temperature of the coldest month |
climate_swe_max_month_mm | mm | climate_coverage | Snow water equivalent in the snowiest month |
climate_days_ge_90f | days/year | climate_extreme_coverage | Days per year at or above 90 °F |
climate_days_le_32f | days/year | climate_extreme_coverage | Days per year at or below 32 °F |
climate_wind_max_annual_ms | m/s | climate_extreme_coverage | Strongest 10 m wind of the year |
climate_coverage | | Whether climate normals was measured on this parcel, or the source does not cover it. | |
climate_extreme_coverage | | Whether hot days, cold days and peak wind was measured on this parcel, or the source does not cover it. |
Sunlight
- Resolution250 m
- Measured overWhole parcel boundary
- Time window1999–2018 average
- UpdatedOn the next model release
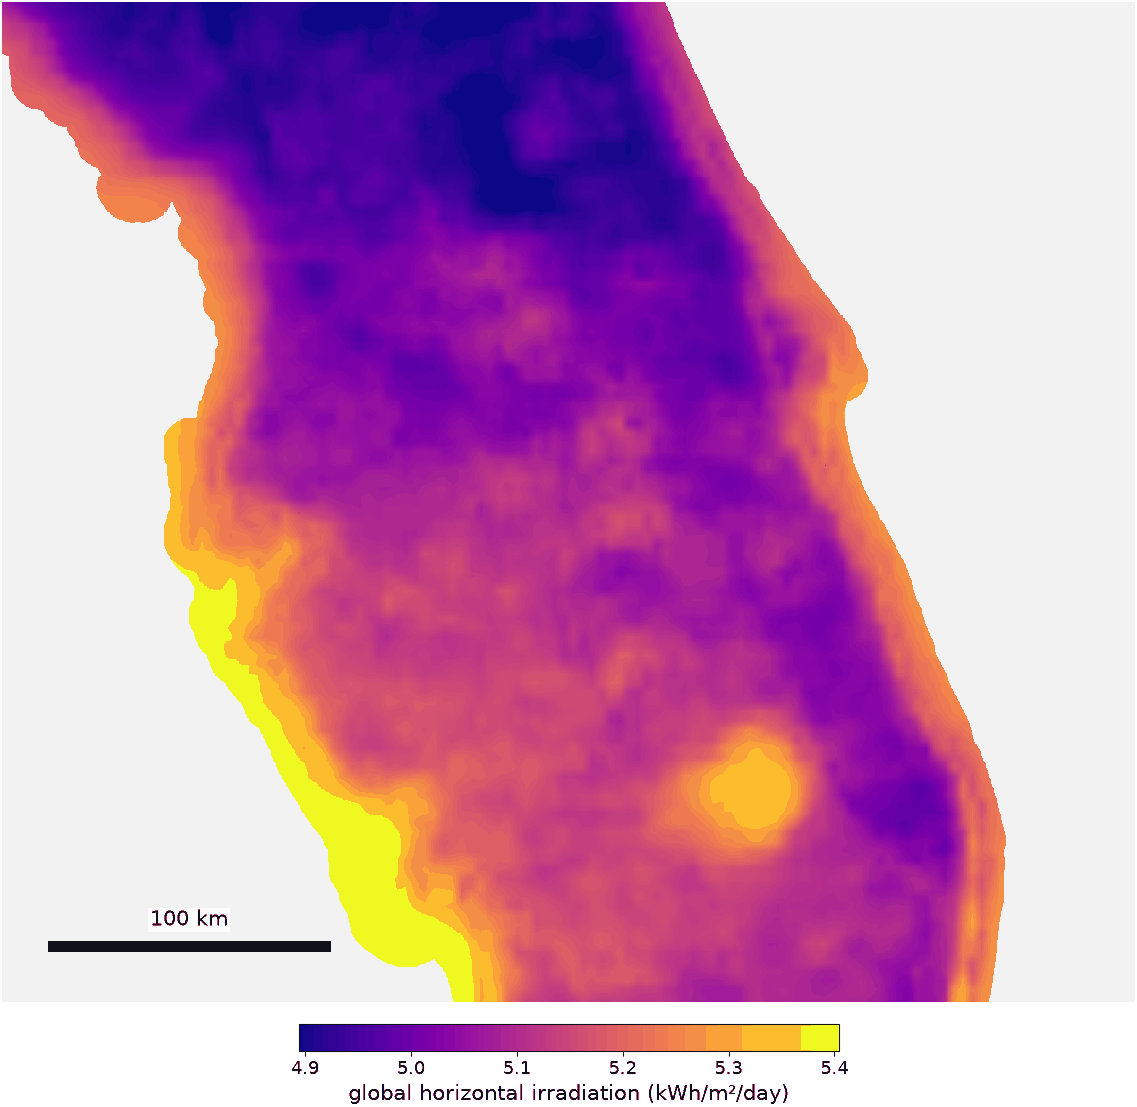
Long-term average global horizontal irradiation over the parcel: the total solar energy received on a horizontal surface, direct and diffuse together, in kilowatt-hours per square metre per day at 250 m. It is modelled from weather-satellite imagery and atmospheric data, not measured on the site.
Readings and coverage
The share of parcels in each state that carry a value for the reading.
- Sunlight — a value on every parcel of all 8 states
Fields
| Field | Unit | Measured flag | Description |
|---|---|---|---|
solar_ghi_mean | kWh/m²/day | solar_coverage | Mean global horizontal irradiance over the parcel. |
solar_coverage | | Whether sunlight was measured on this parcel, or the source does not cover it. |
Air quality
- Resolution1 km
- Measured overWhole parcel boundary
- Time windowPM2.5 2022, NO2 2023
- UpdatedYearly
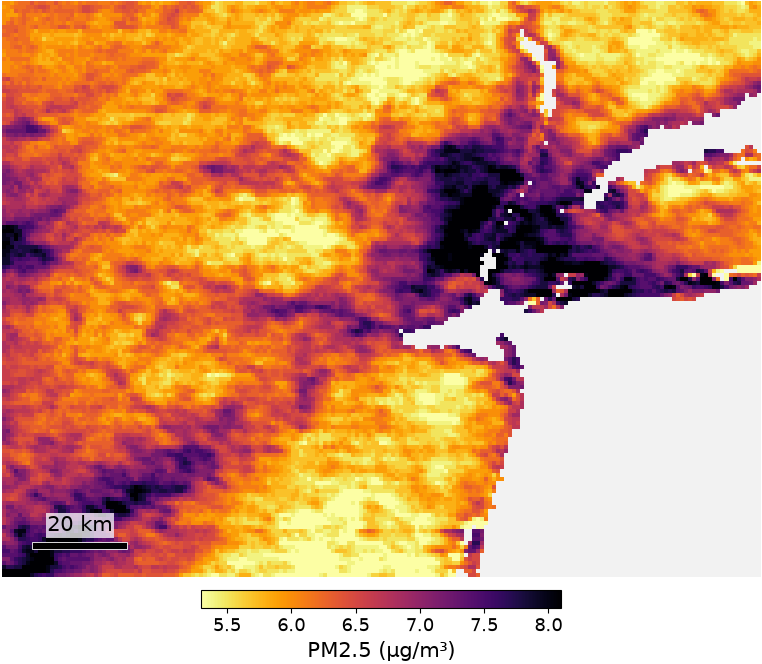
Fine particulate matter as a yearly average on a 0.01° grid, about 1 km, estimated by combining satellite aerosol optical depth retrievals with a chemical transport model and then calibrating to ground-monitor measurements; the mean of the newest five years and the federal annual standard in force for the year sit beside it. Surface nitrogen dioxide is a yearly average on the same grid, from a machine-learning model built on process-based model output, road-network and land-cover predictors, evaluated against 9,913 ground monitors. The publisher states these estimates are primarily intended to aid large-scale studies and are unlikely to fully resolve gradients at the grid resolution.
Readings and coverage
The share of parcels in each state that carry a value for the reading.
- Fine particulate matter — a value on every parcel of all 8 states
- Nitrogen dioxide — a value on every parcel of all 8 states
Fields
| Field | Unit | Measured flag | Description |
|---|---|---|---|
air_quality_pm25_ugm3 | µg/m³ | air_quality_coverage | Fine particulate matter where the parcel sits, as a yearly average. |
air_quality_pm25_year | year | air_quality_coverage | The year that value describes. |
air_quality_pm25_5yr_ugm3 | µg/m³ | | The mean of the newest five yearly values. Empty below five years. |
air_quality_pm25_epa_standard_ugm3 | µg/m³ | | The federal annual standard in force for that year. |
air_quality_no2_ppb | ppb | air_quality_no2_coverage | Surface nitrogen dioxide where the parcel sits, as a yearly average. |
air_quality_no2_year | year | air_quality_no2_coverage | The year that value describes. |
air_quality_coverage | | Whether fine particulate matter was measured on this parcel, or the source does not cover it. | |
air_quality_no2_coverage | | Whether nitrogen dioxide was measured on this parcel, or the source does not cover it. |
Delivery
The same columns in three shapes. A statistic travels with its measured flag, and an unmeasured value is empty, never zero.
| Format | Description |
|---|---|
| GeoJSON | Parcel boundaries with every column. |
| CSV | Every column without the geometry. |
| Map service | Vector tiles for a GIS or a web map. |
Built from the field dictionary of the live data release,
release_20260929_01. Coverage figures are read from that release when the page
loads.